
INTRODUCTION
In this paper, we introduce a digital 2-dimensional (2D) photogrammetry method that utilizes a graphics viewer program to obtain a real metric linear length value from an image in which a marker of a known size is embedded.
Farkas et al. [1] compared facial measurements obtained from life-size printed photographs with direct measurements and reported reliable results for 20 of the 62 measurements. Nechala et al. [2] placed a ruler beside a subject in a photograph to obtain a reproduction ratio for digital 2D photogrammetry. Those methods are difficult to use to assess the results of various types of craniofacial surgery. Moreover, although 3-dimensional (3D) anthropometric equipment is currently available, it has limited applicability in office settings [3-6]. Many physicians still use direct anthropometry or life-size printed photos [7-9]. Mulliken and Sullivan [10] discussed the importance of including some type of calibration in the images used for photogrammetry, and Price et al. [11] used the subjects’ corneal diameter for calibration. However, those authors did not include an assessment of the spherical aberration of the lens in their studies, although this is an important factor in photogrammetry.
This study aimed to obtain a real metric linear length value between 2 points in a non-printed digital image, in which the difference compared to the actual length of the target was <1 mm (adopted from the study of Farkas et al. [1]), thereby simplifying the assessment of surgical results in an ordinary office setting. Graphics viewer programs have tools for measuring linear length or angles in a digital photograph. However, the measured linear length is relative, and it is influenced by image resolution, spherical aberration of the lens, and parallax. We hypothesized that a geometric sphere of known size embedded in the digital image could serve as a calibrator for obtaining this length. It is important to remember that unlike direct measurements, a 2D photograph is an innately distorted relative representation of a real 3D object; therefore, the difference between a photogrammetrically measured value and the real length of a target is due to this relative distortion. For this reason, we used images of a straight-edge ruler, which could be considered as the “absolute” real value. In other words, our experimentation was a process of measuring a ruler. Through these experiments, we attempted to determine the range of our camera’s viewfinder, with the difference between the maximum real ruler lengths and the coupled photogrammetrically measured lengths being <1 mm.
METHODS
A digital single-lens reflex camera (D80; charge-coupled device [CCD] sensor size, 23.6×15.8 mm; optical viewfinder, ×0.94 magnification; Nikon Corp., Tokyo, Japan) was set up on a tripod with a zoom lens (AF-S DX Zoom-NIKKOR 18–135 mm f/3.5-5.6G IFED; Nikon Corp.). We set our camera to aperture priority mode (f/14), ISO 100, a resolution of 1,936×1,296 pixels (S-resolution), and used the built-in flash. A 30-cm straight edge ruler with a yellow sticker at its center was attached horizontally to a vertical flat wall. The composition of the pictures was set for a landscape shot (i.e., the entire length of the ruler filled the width of the viewfinder, with the focus at the center of the yellow sticker) by adjusting the zoom. All images were obtained with the camera positioned horizontally and the CCD arranged in parallel with the ruler, even for the 2 vertical images. The experimental sequence was as follows: 1) environmental factors were assessed; 2) a convenient but reliable camera-to-object distance (OD) range was determined; 3) the most reliable aperture size of the camera was determined; 4) the optimum marker size was determined; and 5) the effects of changes in the composition of the photogram were evaluated.
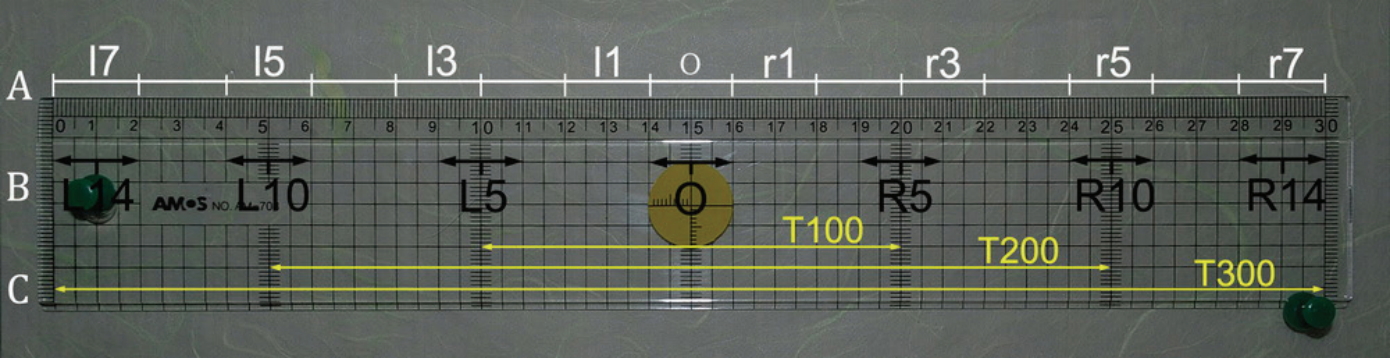
To assess environmental factors, including the pattern of the spherical aberration of our lens, we obtained 2 horizontal and vertical images of the ruler with an OD of 100 cm, and 2 additional images of the reverse arrangement (i.e., the ruler was turned 180° in the clockwise direction in each position). These 4 images were divided into 15 sequential segments of 20-mm ruler gradations (not 20-mm in length), and each segment was measured using a graphics viewer program (IrfanView version 4.36; Irfan Skiljan, Wiener Neustadt, Austria) [12]. The measured values were subsequently processed as described below (Fig. 1A and 2).
To determine a convenient but reliable OD range, 3 images were obtained with ODs of 50, 100, and 150 cm, with an effort to maintain the abovementioned horizontal composition to the extent possible. Each photogram was vertically divided into 7 segments of 20-mm gradations (Fig. 1B), and each segment was measured using IrfanView. The measured raw data were calibrated based on the known real length value of the central 20-mm, using the following equation (Table 1):
A, the known real value of the central segment O (20-mm); B, the measured value of segment O (mm); C, the measured value of each segment (mm); D, the calibrated value of each segment (mm).
We used Excel 2010 (Microsoft Corp., Redmond, WA, USA) for the calculations and for generating the chart figures. The absolute differences between the calibrated values and real values of the coupled segments were converted into percentages; these data are presented in charts (Fig. 3 and Table 1).
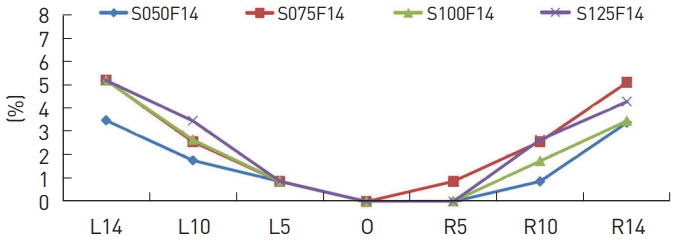
We processed 2 images with ODs of 50 and 100 cm and 2 additional images with ODs of 75 and 125 cm, as described above (Fig. 4).
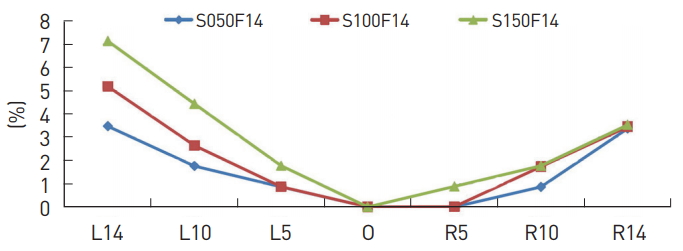
To determine the most reliable aperture size of the lens, we obtained 2 additional photographs (OD=100 cm; aperture size, f/5.6 and f/36, which are at the extreme ends of the f-numbers). The 3 photographs with the f/5.6, f/14, and f/36 aperture sizes were processed as described above (Fig. 5). Based on this chart, we found that the data obtained from the photographs with an aperture size of f/14 were the most reliable. Therefore, we selected 6 additional circumjacent f-numbers (f/10, f/11, f/13, f/16, f/18, and f/20) and took 6 additional photographs, with an OD of 100 cm. We processed the 7 photographs as described above (Fig. 6). The 7 curves in Fig. 6 show that the curves of the f/13, f/14, and f/16 sizes had relatively low percentage differences and better symmetry. Thus, we took 8 additional photographs (OD=50, 75, 100, and 125 cm; aperture size, f/13 and f/16). We grouped the 12 photographs by the f-number and measured 15 circumjacent ranges of the center (20, 40, 60, 80, 100, 120, etc., through 300-mm gradations) from the 4 images with an OD of 50, 75, 100, and 125 cm in each group (Fig. 1C). We processed the obtained data as described above, and we generated charts of the percentage differences, and found that the chart for the aperture size f/16 showed the lowest and most regular pattern of difference (Fig. 7).
To determine the most favorable size of the marker with the f/16 image (OD=100 cm), we measured each of the 30-mm ruler gradations circumjacent to the 7 dividing points with IrfanView, calibrated them using the known real value of the central 10, 20, and 40 mm as hypothetical calibrators, and generated a chart of the percentage differences (Fig. 1B and 8). We changed the compositions of the photograph as follows: one was changed to have the entire length of the ruler occupying the central two-thirds of the width of the viewfinder, and the other was changed to have the central one-third shown with a higher resolution of 3,872×2,592 pixels (L-resolution) to obtain a clear enlarged image of the ruler to measure. From those 2 images, we also measured 15 circumjacent ranges of the center and generated a chart of the percentage differences (Fig. 1C and 9).
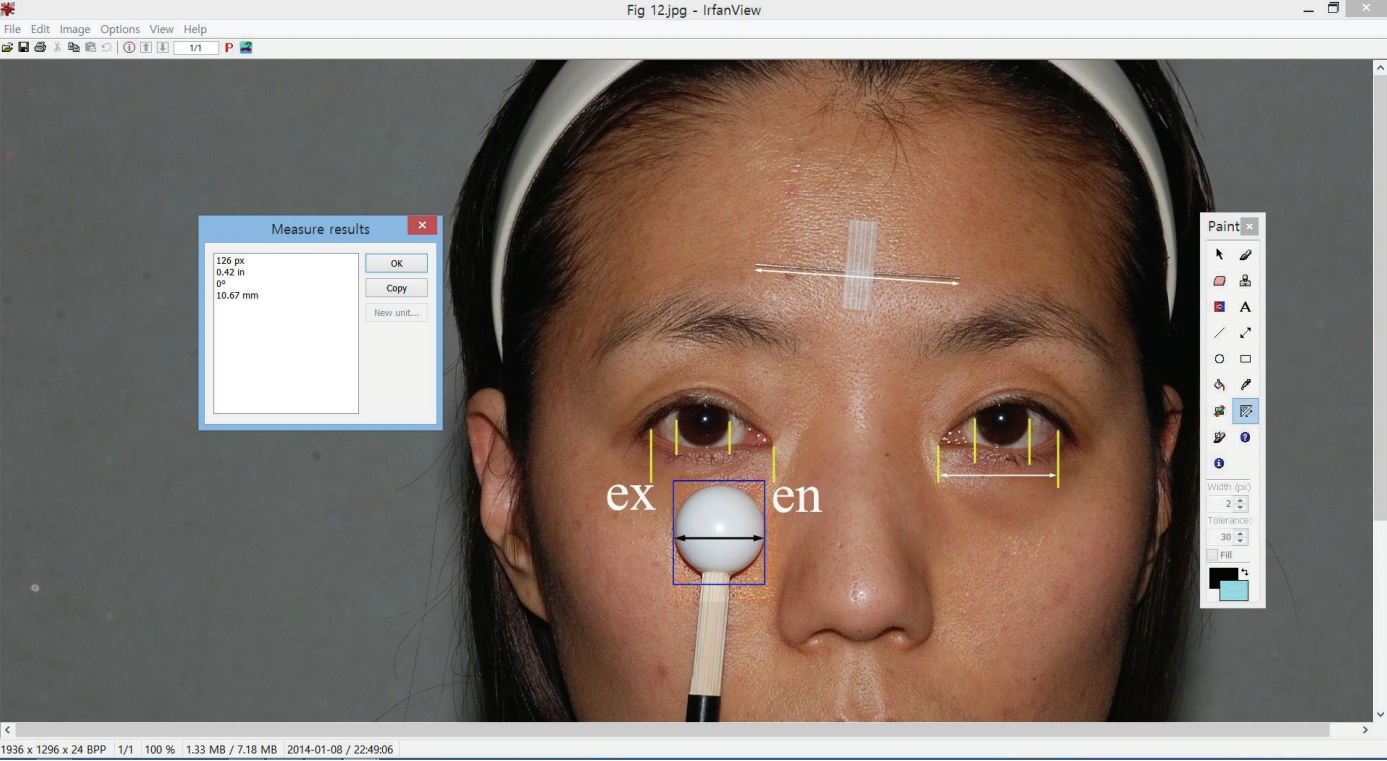
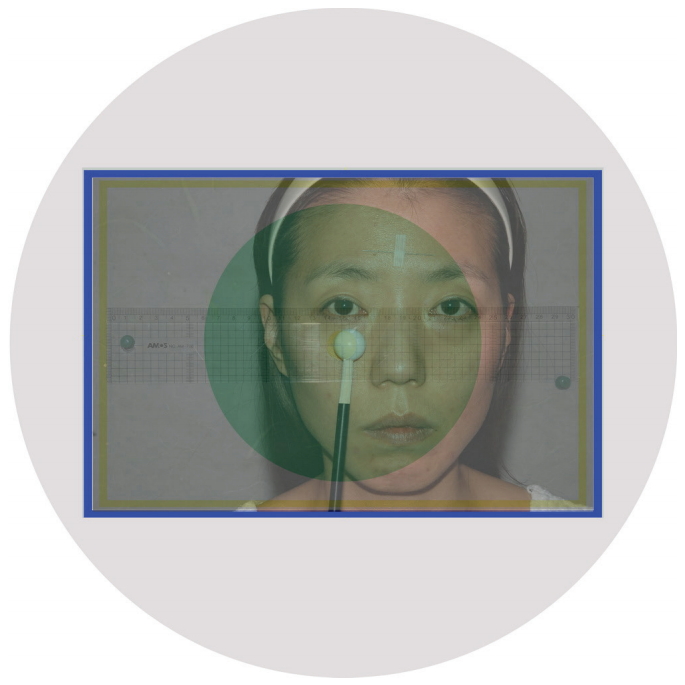
Finally, we generated a plastic geometrical sphere 20-mm in diameter and attached it to a 15-cm long bamboo stick (like a lollipop); thereafter, the concept of the central 20-mm of the ruler was replaced with the sphere, and the ruler was replaced with a face. While holding the camera in both hands, we took 5 photographs of a subject on whom the spherical marker was placed at unknown ODs within the 50 to 125 cm range (over-the-desk width), at f/16, ISO 100 (ISO auto maximum sensitivity 400), with the focus on the sphere. We composed the measuring area within the central 1/2 of the viewfinder with the aid of the viewfinder grids. Subsequently, we obtained the absolute differences between the measurements that were performed using the method described above from these 5 sphere-embedded images and direct measurements of the periorbital area of the same subject (Fig. 10 and Table 2). Before measuring the landmarks, the interpupillary line was arrayed horizontally, and adequate digital magnification of the image was attained using IrfanView; thereafter, to measure the diameter of the sphere, the boundary of the sphere was selected as an exact rectangle, and the length of a side of a square was measured (Fig. 10). Direct measurement was performed using the projective method with Vernier calipers, up to units of 0.5 mm, the smallest unit of the caliper.
RESULTS
The percentage differences were higher on the left and upper sides of the images and were remarkably lower in the vertical images (Fig. 2).
All calibrated values fell into a very narrow range, with the leftside and peripheral values being larger (Table 1). However, the magnitude of the differences stood out after the data were converted to percentages. The charts of the percentage differences in the ODs showed a similar symmetric pattern of curves dispersing peripherally within the 50 to 125 cm OD range (Fig. 4). The most regular and lowest differences were found for the f/16 images (Fig. 5 and 6). The highest percentage difference was 0.48% (160 ×0.48% = 0.77 mm) for the 160-mm length and 0.71% (180×0.71%=1.28 mm) for the 180-mm length, and the percentage differences and measured target lengths around the center were almost directly proportional to each other (Fig. 7).
Among the 3 hypothetical marker sizes, the 20-mm size showed the least differences (Fig. 8).
In the images with altered compositions, the magnitudes of the percentage differences showed a remarkable distinction between the 2 compositions (Fig. 9).
In clinical applications, differences greater than 0.5 mm were observed for measurements of the inter-exocanthion and artificial landmark lengths, and the highest value was 0.97 mm (Table 2).
DISCUSSION
Our hypothesis that a geometric sphere of known size embedded in a digital image can serve as a calibrator for obtaining the length between 2 points in the image was proven in this study. In the clinical application, the greatest difference between photogrammetric measurements and direct measurements was 0.97 mm (Fig. 10 and Table 2).
Theoretically, within the central half-circular area (160/300× 0.94=0.50) of an image taken by our camera lens, set with an aperture size of f/16, focused on the marker, and an OD between 50 and 125 cm, a target length of up to 160 mm could be measured, with a difference of <1 mm (Fig. 7). In other words, the central half (160/300, more exactly) area of the width of the viewfinder was the theoretical reliable circle of our camera with the lens. Considering that the maximum breadth of a subject, between the eurion to eurion in adult males, is on average 153 mm [1], this length limit would be an adequate range for assessing the results of facial surgery. In the study of Farkas et al. [1], the most important distortion and limitation were found in the measurements between points at the distant coronal and sagittal levels in the frontal and profile view, respectively. This finding could be explained by the spherical aberration and reducible by changing the composition of a photograph with a higher resolution, as shown in Fig. 9.
In clinical applications, to decrease this difference, the calibrator should be moved as close as possible to the target to be measured. Moreover, as in other types of photogrammetry, the importance of using a photographic technique that does not generate parallax to the target structure must be emphasized. For the corneal diameter, the percentage difference was higher on the left side than on the right side, because the calibrator was positioned on the right side of the image (Table 2).
In 1949, Tanner and Weiner [13] suggested the importance of photogrammetry in medical assessments, which was followed by similar reports [1,2,14,15]. The importance of some type of calibration in the image was emphasized by Mulliken and Sullivan [10]. The results of facial surgery can be assessed anthropometrically and clearly summarized in tabular form in order to present a large number of operated cases. We think that this is the principal point of importance that was suggested by many authors who studied various kinds of anthropometric measurements. The diameter of a geometric sphere, unlike a flat ruler [2], does not fluctuate according to the viewing angle; therefore, it is an adequate calibrator. Price et al. [11] used the subjects’ corneal diameter for calibration, but that technique has limited applicability in terms of position and viewing angle, and has individual differences. Our sphere, which was 20-mm in diameter (range of fabrication error, 1/100 mm), was generated with the help of a factory that conducts micro-milling operations.
The spherical aberration of the lens we used was slightly higher towards the left and upper sides, but the magnitude of difference between each coupled image of the reversed object position could have been caused by measurement errors, inaccuracies in the photography technique, and even by the ruler itself (Fig. 2). The noticeable difference between the horizontal and vertical images (Fig. 2) and the results of the changed composition of Fig. 9 were anticipated when considering the relationship between the image circle of a lens and the CCD sensor of a camera (Fig. 11).
In the study of Farkas et al., the OD chosen to reduce photographic error was 11 feet (i.e., 3.35 m) [1], which is too large for the assessment of surgical results. The OD range in our study (50-125 cm) is convenient for obtaining clinical photographs in an office setting, with no limitation in the angle of view with the sphere.
Among the 3 tested hypothetical marker sizes, the most favorable result was obtained for the 20-mm size (Fig. 8). However, the theoretical basis for this finding could not be explained. Additively, with sequential images, the excursion of a landmark would also be measurable.
Our method could be used as a technique for determining the reliable circle of a photography system for photogrammetry. The reliable circle would be expected to be wider in a higher quality lens with lower magnitude and further symmetricity of its spherical aberration, and especially with respect to the width of the image circle (Fig. 11). IrfanView is an inexpensive but fast and compact program that has many useful tools for photogrammetry [12].
Further, more refined investigations with various camera bodies and lenses are required. A summary of the findings of this study is provided in Fig. 11.