INTRODUCTION
The wound-healing process involves four cascades: hemostasis, inflammation, proliferation, and remodeling. These cascades are regulated by numerous feedback and feedforward regulatory loops driven by signals from the wound microenvironment. Normal wound healing activates stop signals when a wound is closed and epithelialization is complete [1]. When these stop signals are inactive, the wound-healing process continues, causing excessive scar formation.
Hypertrophic scars and keloids are unique to humans and do not occur in animals for unknown reasons [1]. A hypertrophic scar is a fibroproliferative disorder characterized by raised, red, nodular, inelastic scars that undergo slow, incomplete regression compared to normal scars [2]. They are caused by excessive collagen synthesis and deposition from fibroblasts. Cytokines are important regulators of wound healing and scar formation [2].
Transforming growth factor beta-1 (TGF-β1) is a multifunctional cytokine produced by a numerous cell types [3]. TGF-β plays an important role in the regulation of cellular growth, differentiation, adhesion, and apoptosis [4-6]. TGF-β stimulates skin fibroblasts to increase the production of extracellular matrix (ECM), including collagen, fibronectin, and proteoglycan, and to decrease the production of matrix-degrading proteases. As a result, TGF-β simultaneously provokes the deposition of the ECM [4,6]. TGF-β1 is the most fibrogenic isoform of this growth factor [7].
We hypothesized that the expression of TGF-β1 mRNA and protein by fibroblasts is proportional to the clinical severity of hypertrophic scars. We classified hypertrophic scars into four grades, according to the Vancouver Scar Scale [8]: grade 1 scars were defined as mildly elevated (<2 mm), pink, and yielding hypertrophic scars; grade 2 scars were defined as moderately elevated (2–5 mm), red, and yielding hypertrophic scars; grade 3 scars were defined as moderately elevated (2–5 mm), red, and firm hypertrophic scars; and grade 4 scars were defined as severely elevated (>5 mm), purple, and firm hypertrophic scars. To verify this hypothesis, we measured the production of TGF-β1 protein and mRNA levels from normal human skin fibroblasts and four grades of hypertrophic scars using an in vitro serum-free culture system.
METHODS
Culturing normal dermal tissue and hypertrophic scar fibroblasts
Normal dermal tissue (NS) was obtained from six patients who underwent performed blepharoplasty. Hypertrophic scar tissues were obtained from six patients having all scar grades (HS1, HS2, HS3, and HS4). This study was approved by the institutional review board of Soonchunhyang University, Bucheon Hospital (SCHBC_IRB_2013-39).
The tissue samples were minced into 0.5 to 1 mm3 fragments on a clean bench and washed in phosphate-buffered saline containing 100 U/L penicillin and 100 mg/L streptomycin. Then, 700 μL Dulbecco’s modified Eagle’s medium (DMEM) supplemented with 20% fetal bovine serum (FBS) were placed in six-well cell culture flasks, and each well was plated with three to five fragments. After 4 hours, the culture medium was added. The flasks were incubated at 37°C under 5% CO2 for 24 hours. The minced fragments were removed, and the DMEM was changed every 2 days. The flasks were examined daily by light microscopy for fibroblast outgrowth. When the fibroblast outgrowth approached confluence, subculturing (3,500 cell/cm2) was performed. In the passage 1 subculture, the culture medium was changed to DMEM containing 15% FBS; in the passage 2 subculture, the culture medium was changed to DMEM containing 10% FBS.
Subculturing was performed after the fibroblasts had spread on the bottom of the cell culture flask. The fibroblasts were used at passage 4. The fibroblasts were released from the culture flask using 0.05% trypsin. After confirming cellular release from the flask wall by light microscopy, trypsin soybean inhibitor was added to each flask in a 1:1 ratio to inactivate the trypsin. The fibroblasts were subcultured into six-well cell culture flasks at a density of 1.5 ×10⁵ cells per well in DMEM containing 10% FBS. After 24 hours, the medium was replaced with DMEM containing 2% FBS. The flasks were incubated at 37°C under 5% CO2 for 96 hours.
Quantitative-competitive ELISA for TGF-β1
First, 1 mL medium was harvested from each well and centrifuged for 20 minutes at 1,000×g at 4°C. The cell-free supernatant was evaluated using a solid-phase, enzyme-linked immunosorbent assay (ELISA) using the Quantikine ELISA kit for TGF-β1 (R&D Systems, Minneapolis, MN, USA). The optical densities of the samples were determined using an automated plate reader.
Total RNA isolation from fibroblasts using TRIzol
Fibroblasts (1×10⁶) were combined with 1 mL TRIzol (Invitrogen, Carlsbad, CA, USA) reagent and homogenized. The homogenate was allowed to stand for 5 minutes. Then, 200 μL chloroform (per 1 mL TRIzol) were added, and the mixture was shaken vigorously for 15 seconds. The sample was allowed to stand for 3 minutes at room temperature and centrifuged at 12,000×g at 4°C for 15 minutes. The colorless, upper aqueous phase was transferred to a diethylpyrocarbonate (DEPC)-treated Eppendorf centrifuge (EP) tube. Next, 500 μL of 100% isopropanol and 1 mL TRIzol were added to the aqueous phase and inverted 30 times. After incubating for 10 minutes at room temperature, the mixture was centrifuged for 10 minutes at 12,000×g at 4°C. The isopropanol layer was decanted, and the RNA pellet was washed with 1 mL cold 75% DEPC-treated water/ethyl alcohol. The samples were centrifuged for 5 minutes at 7,500×g at 4°C, and the supernatant was decanted carefully. The pellet was allowed to air dry for 5 to 10 minutes at room temperature under a laminar flow hood without over drying. Then, 20 μL DEPC-treated H2O were added to the dried pellet and mixed with a pipette tip on ice. The RNA samples were warmed to 55 to 65°C in a heating block for 10 to 15 minutes. To assess the quantity and purity of the RNA, the optical density of the total RNA (diluted 1:100 with DEPC-treated H2O) was determined by spectrophotometry.
Quantitative reverse transcription-polymerase chain reaction (RT-PCR)
Purified total RNA was reverse-transcribed to first-strand cDNA using oligo-(dT) with a SuperScript II First Strand Synthesis System (Invitrogen Life Technologies, Carlsbad, CA, USA), according to the manufacturer’s recommendations. The specific primer pairs for RT-PCR were as follows: Beta-actin forward, 5ʹ-CATGTACGTT GCTATCCAGGC-3ʹ; Beta-actin reverse, 5ʹ-CTCTTAATGTCACG CACGAT-3ʹ; TGF-β1 forward, 5ʹ-CTAATGGTGGAAACCCACA ACG-3ʹ; and TGF-β1 reverse, 5ʹ-TATCGCCAGGAATTGTTGC TG-3ʹ.
Amplification consisted of an initial denaturation at 94°C for 5 minutes, followed by 35 cycles of 30 seconds at 94°C, 30 seconds at 55°C, and 40 seconds at 72°C, and a final extension at 72°C for 10 minutes. The size and amount of the PCR products generated were determined by agarose gel electrophoresis in the presence of ethidium bromide and analyzed with by Kodak EDAS 1D software (Kodak, New Haven, CT, USA). The RT-PCR products were identified by a BLAST search after direct sequencing.
RESULTS
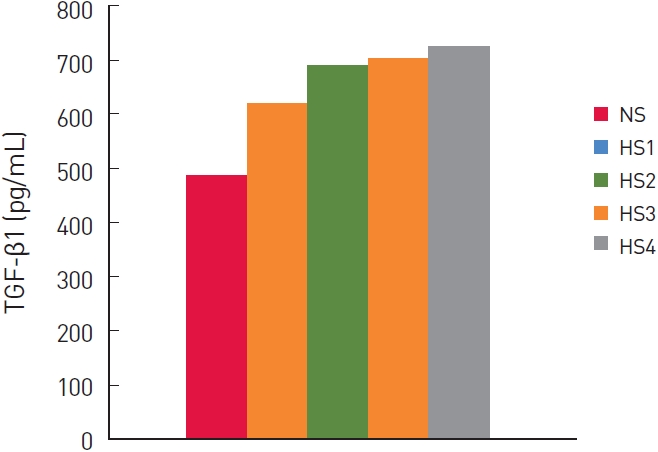
TGF-β1 protein levels of the cell lines were determined using ELISA. Six pairs of HS1, HS2, HS3, HS4, and NS samples were examined (Table 1). Overall, normal dermal fibroblasts produced 518.38 ±13.53 pg TGF-β1 protein/mL. The grade 1 to 4 hypertrophic scar fibroblasts produced 643.31±12.5, 719.60±6.43, 729.43±3.11, and 746.07±5.86 pg TGF-β1 protein/mL (Fig. 1). The differences between the NS, HS1, and HS4 groups were statistically significant (P<0.01).
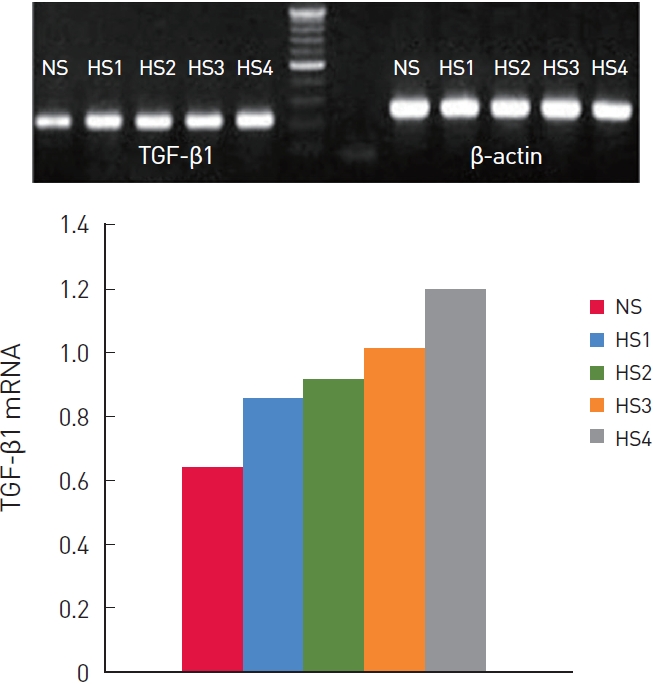
Relative TGF-β1 mRNA levels were quantified and compared by RT-PCR in six pairs of hypertrophic scar and normal fibroblast lines (Table 2). The normal dermal fibroblasts expressed 0.71±0.01 (TGF-β1/β-actin) TGF-β1 mRNA.
Grade 1 to 4 hypertrophic scar fibroblasts expressed 0.92±0.01, 0.98±0.01, 1.07±0.02, and 1.24±0.04 TGF-β1 mRNA (Fig. 2). The differences between the NS, HS1, HS2, HS3, and HS4 groups were statistically significant (P<0.01).
DISCUSSION
Dermal fibroblasts facilitate wound healing by migrating to the wound, forming granulation tissue, and synthesizing ECM components [9]. Moreover, they generate the mechanical force that initiates wound contraction [10], which contributes to wound healing by decreasing the wound area and forming a scar [11]. However, undesirable wound contraction can lead to cosmetic and functional problems [12-14].
A hypertrophic scar is a common complication of wound healing in patients who had thermal and other dermal injuries [15]. It involves the abnormal proliferation of fibroblasts and overproduction of collagen and ECM [15,16]. Hypertrophic scar formation is regulated by the activity of TGF-β [15].
TGF-β1 plays a vital role in the pathogenesis of hypertrophic scar formation [11,17]. Hypertrophic scar fibroblasts produce more TGF-β1 protein and mRNA than do normal dermal fibroblasts [2,11]. TGF-β1 induces fibroblast proliferation and the synthesis of ECM components, such as elastin, fibronectin, and collagen [17-19]. In vitro, TGF-β1 reduces the collagenase-mediated degradation of the wound matrix and indirectly stimulates matrix growth by inducing platelet-derived growth factor [17,20,21]. TGF-β1 enhances the contraction of collagen gel and thus of the wound itself [22-24]. An important role of TGF is underpinned by the fact that neutralizing antibodies to TGF inhibit hypertrophic scar formation [17,25-27].
We compared TGF-β1 protein and mRNA levels in normal and hypertrophic scar dermal fibroblasts. The hypertrophic scar dermal fibroblasts were divided into four groups based on the Vancouver Scar Scale. Production of TGF-β1 protein by normal and hypertrophic scar dermal fibroblasts differed significantly. There were statistically significant differences among the NS, HS1, and HS4 groups. Although the TGF-β1 protein of the HS2 and HS3 groups tended to increase with the clinical severity of the hypertrophic scars, there was no significant difference between the HS2 and HS3 groups.
TGF-β1 mRNA expression also differed significantly between normal and hypertrophic scar dermal fibroblasts. There were statistically significant differences among the NS, HS1, HS2, HS3, and HS4 groups.
We hypothesized that the production of TGF-β1 protein and mRNA would increase with the Vancouver Scar Scale of hypertrophic scarring. The production of TGF-β1 tended to increase with the Vancouver Scar Scale, and the differences were significant, except for groups HS2 and HS3. Regarding TGF-β1 mRNA expression, the differences between the HS1, HS2, HS3, and HS4 groups were statistically significant, which can be attributed to the inherent variability in TGF-β1 expression in our hypertrophic scar dermal fibroblast lines, possibly correlating with the clinical heterogeneity of the hypertrophic scars. That is, the TGF-β1 protein levels of a hypertrophic scar may not necessarily match its RNA levels.
Our study has two limitations. One is that the hypertrophic scar tissues that we studied each had different scar maturation times. The other limitation is that the hypertrophic scar grades are subjective criteria. However, despite these limitations, we can conclude that the classification of hypertrophic scars using the Vancouver Scar Scale usually reflects the microenvironment of hypertrophic scar formation.